Redmine Gantt Chart – the Redmine timeline plugin for delivery teams.
For project managers running multi-team delivery on Redmine.
one-time purchase · 1 year of support included
Support renewal after 1 year 30% of plugin price
Today in Redmine
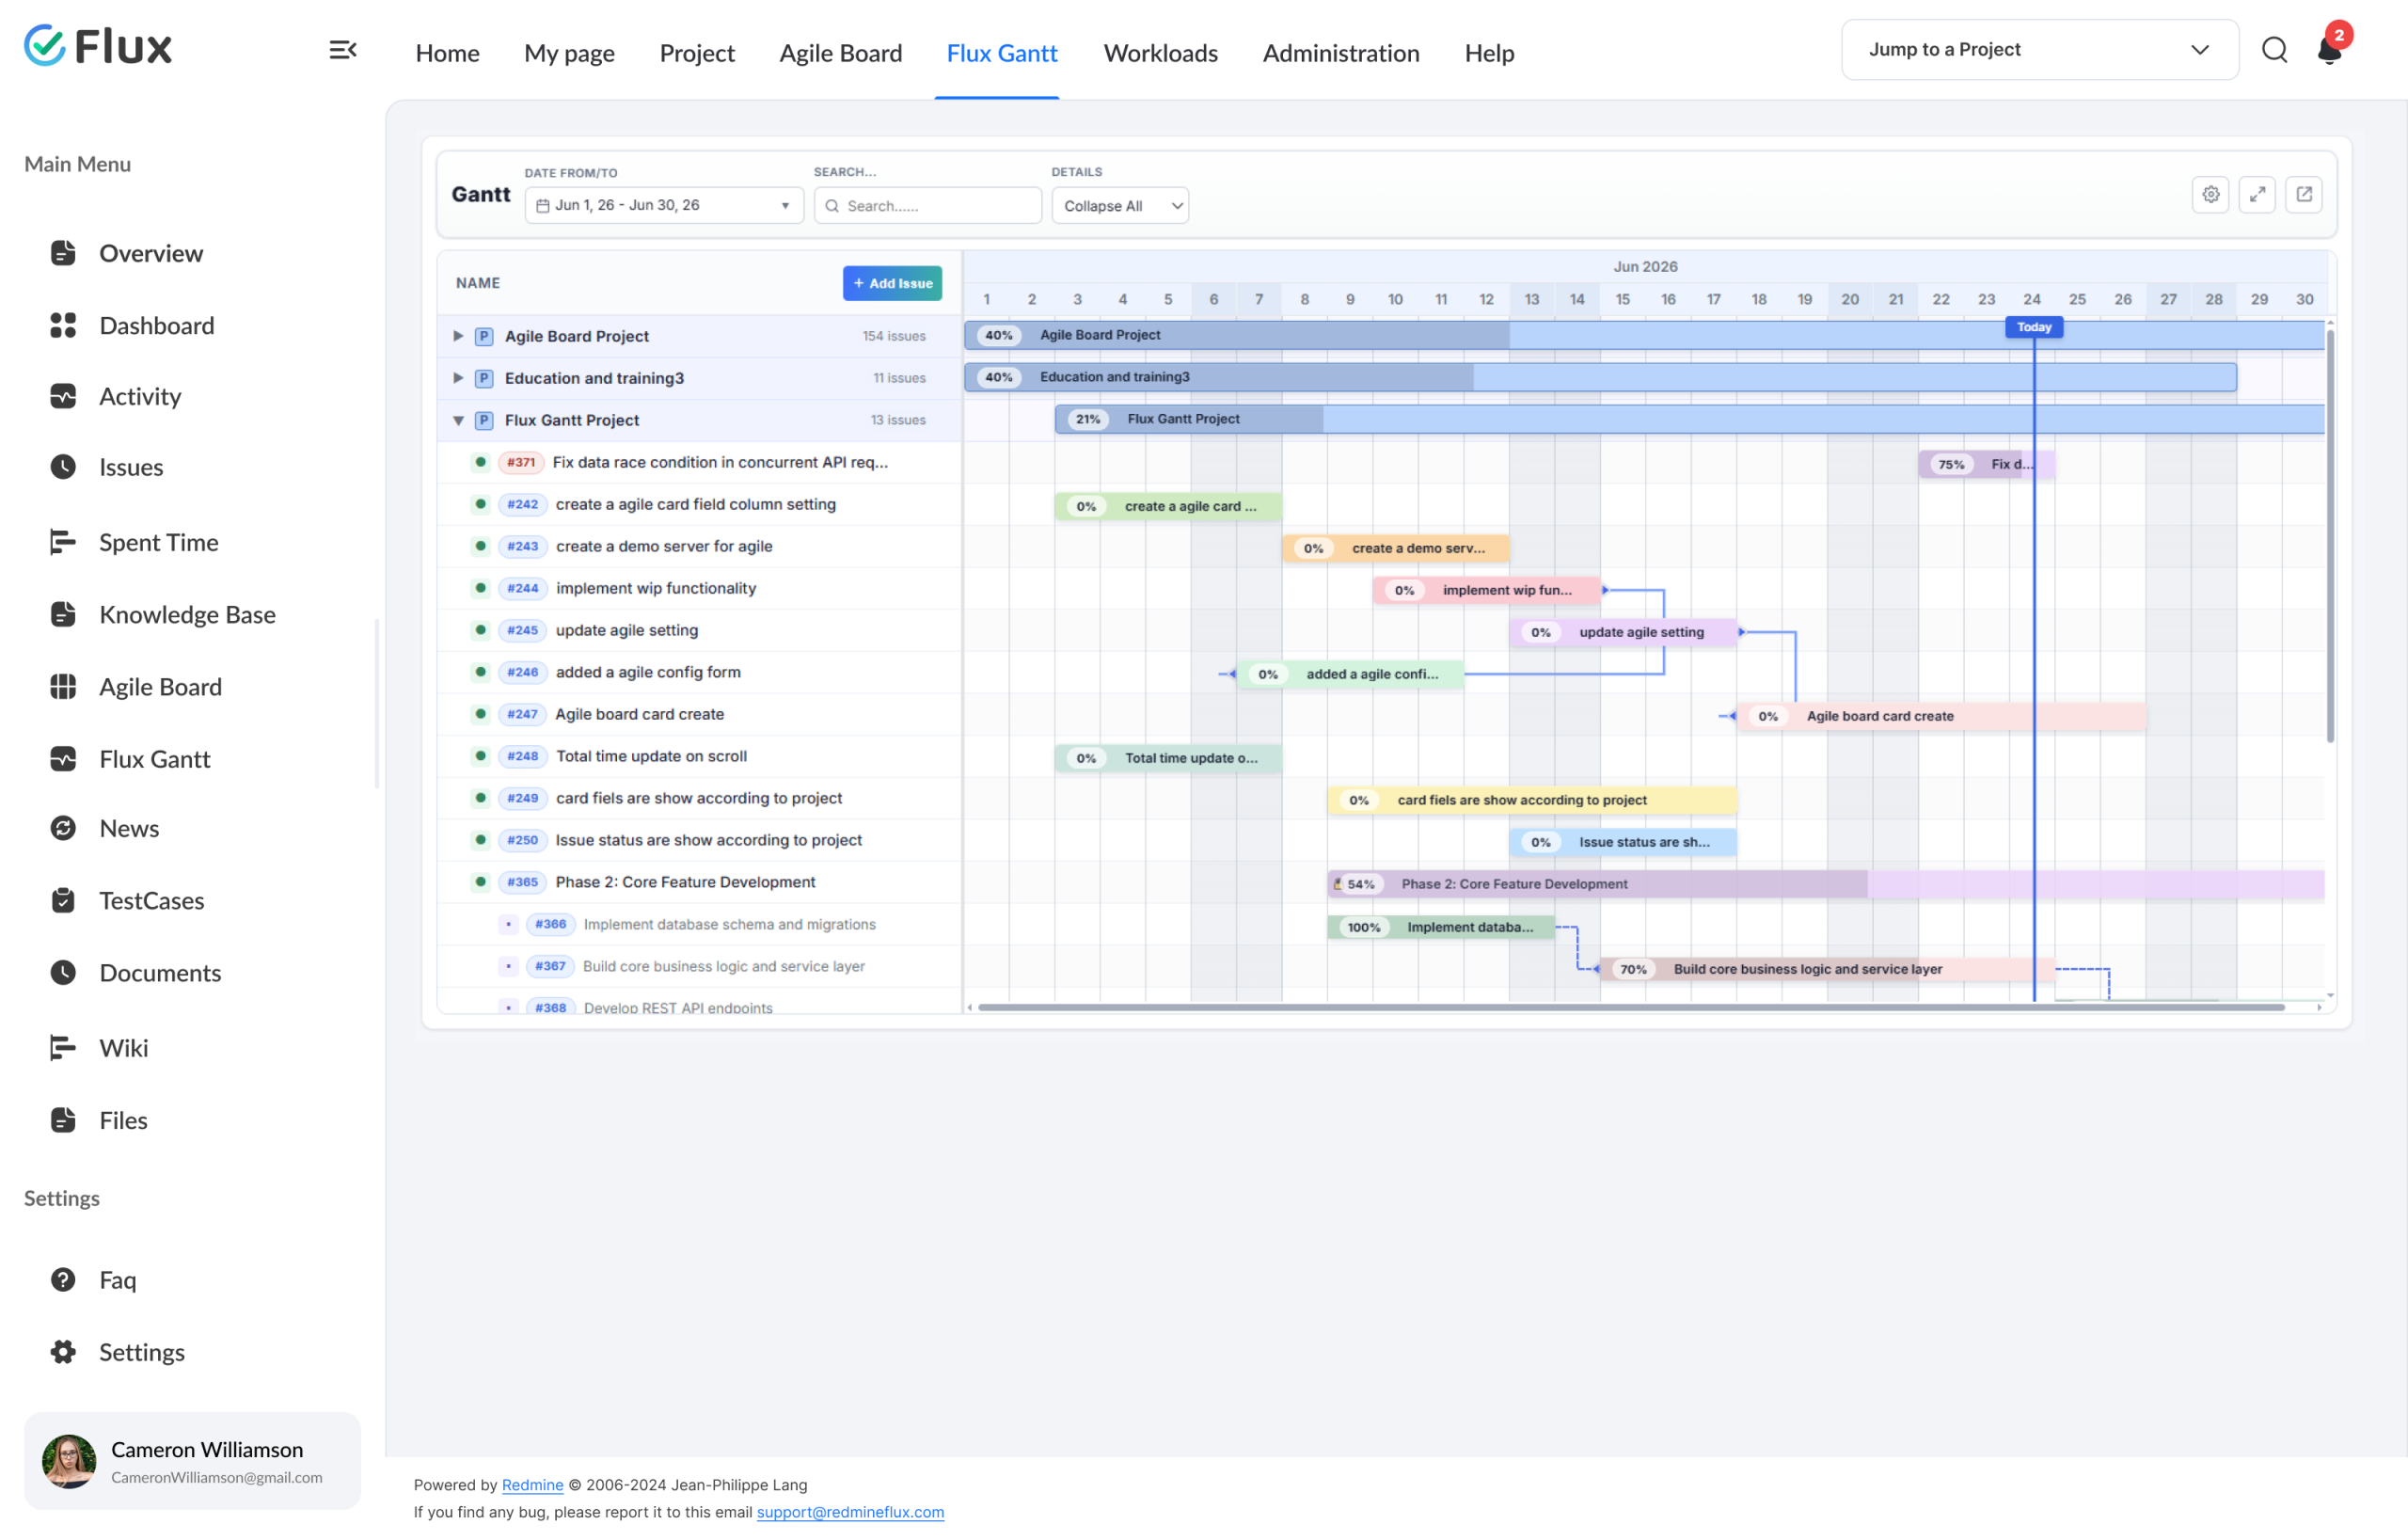
Redmine’s built-in Gantt is read-only – you can’t drag a task or link a dependency.
Redmine includes a basic Gantt view, but it is read-only – which creates real planning problems for project managers and delivery leads who need to adjust timelines as delivery evolves. Dragging or editing tasks directly on the chart is not possible. Dependency linking between tasks is absent, so cascade delays go undetected until they have already affected downstream work. Reschedules require opening and editing each issue individually, which makes timeline adjustments slow and error-prone.
In plain words
What is the Redmineflux Gantt Chart Plugin?
The Redmineflux Gantt Chart Plugin adds interactive timeline editing directly to Redmine. It lets project managers drag tasks to reschedule, link dependencies, add releases as timeline anchors, and see the full project timeline in a single view – all without leaving the Redmine environment or importing data to an external planning tool.
A full Gantt layer, inside Redmine.
The Gantt Chart Plugin enhances Redmine without replacing it. Every task is draggable. Every dependency is visible as a line on the chart. Releases mark key delivery points — go-live dates, version cuts, client review checkpoints.
Project managers who previously maintained a separate Gantt tool can consolidate timeline planning into Redmine – the same environment where issues are created, tracked, and closed. Redmine, upgraded for operational maturity.
What your team gains
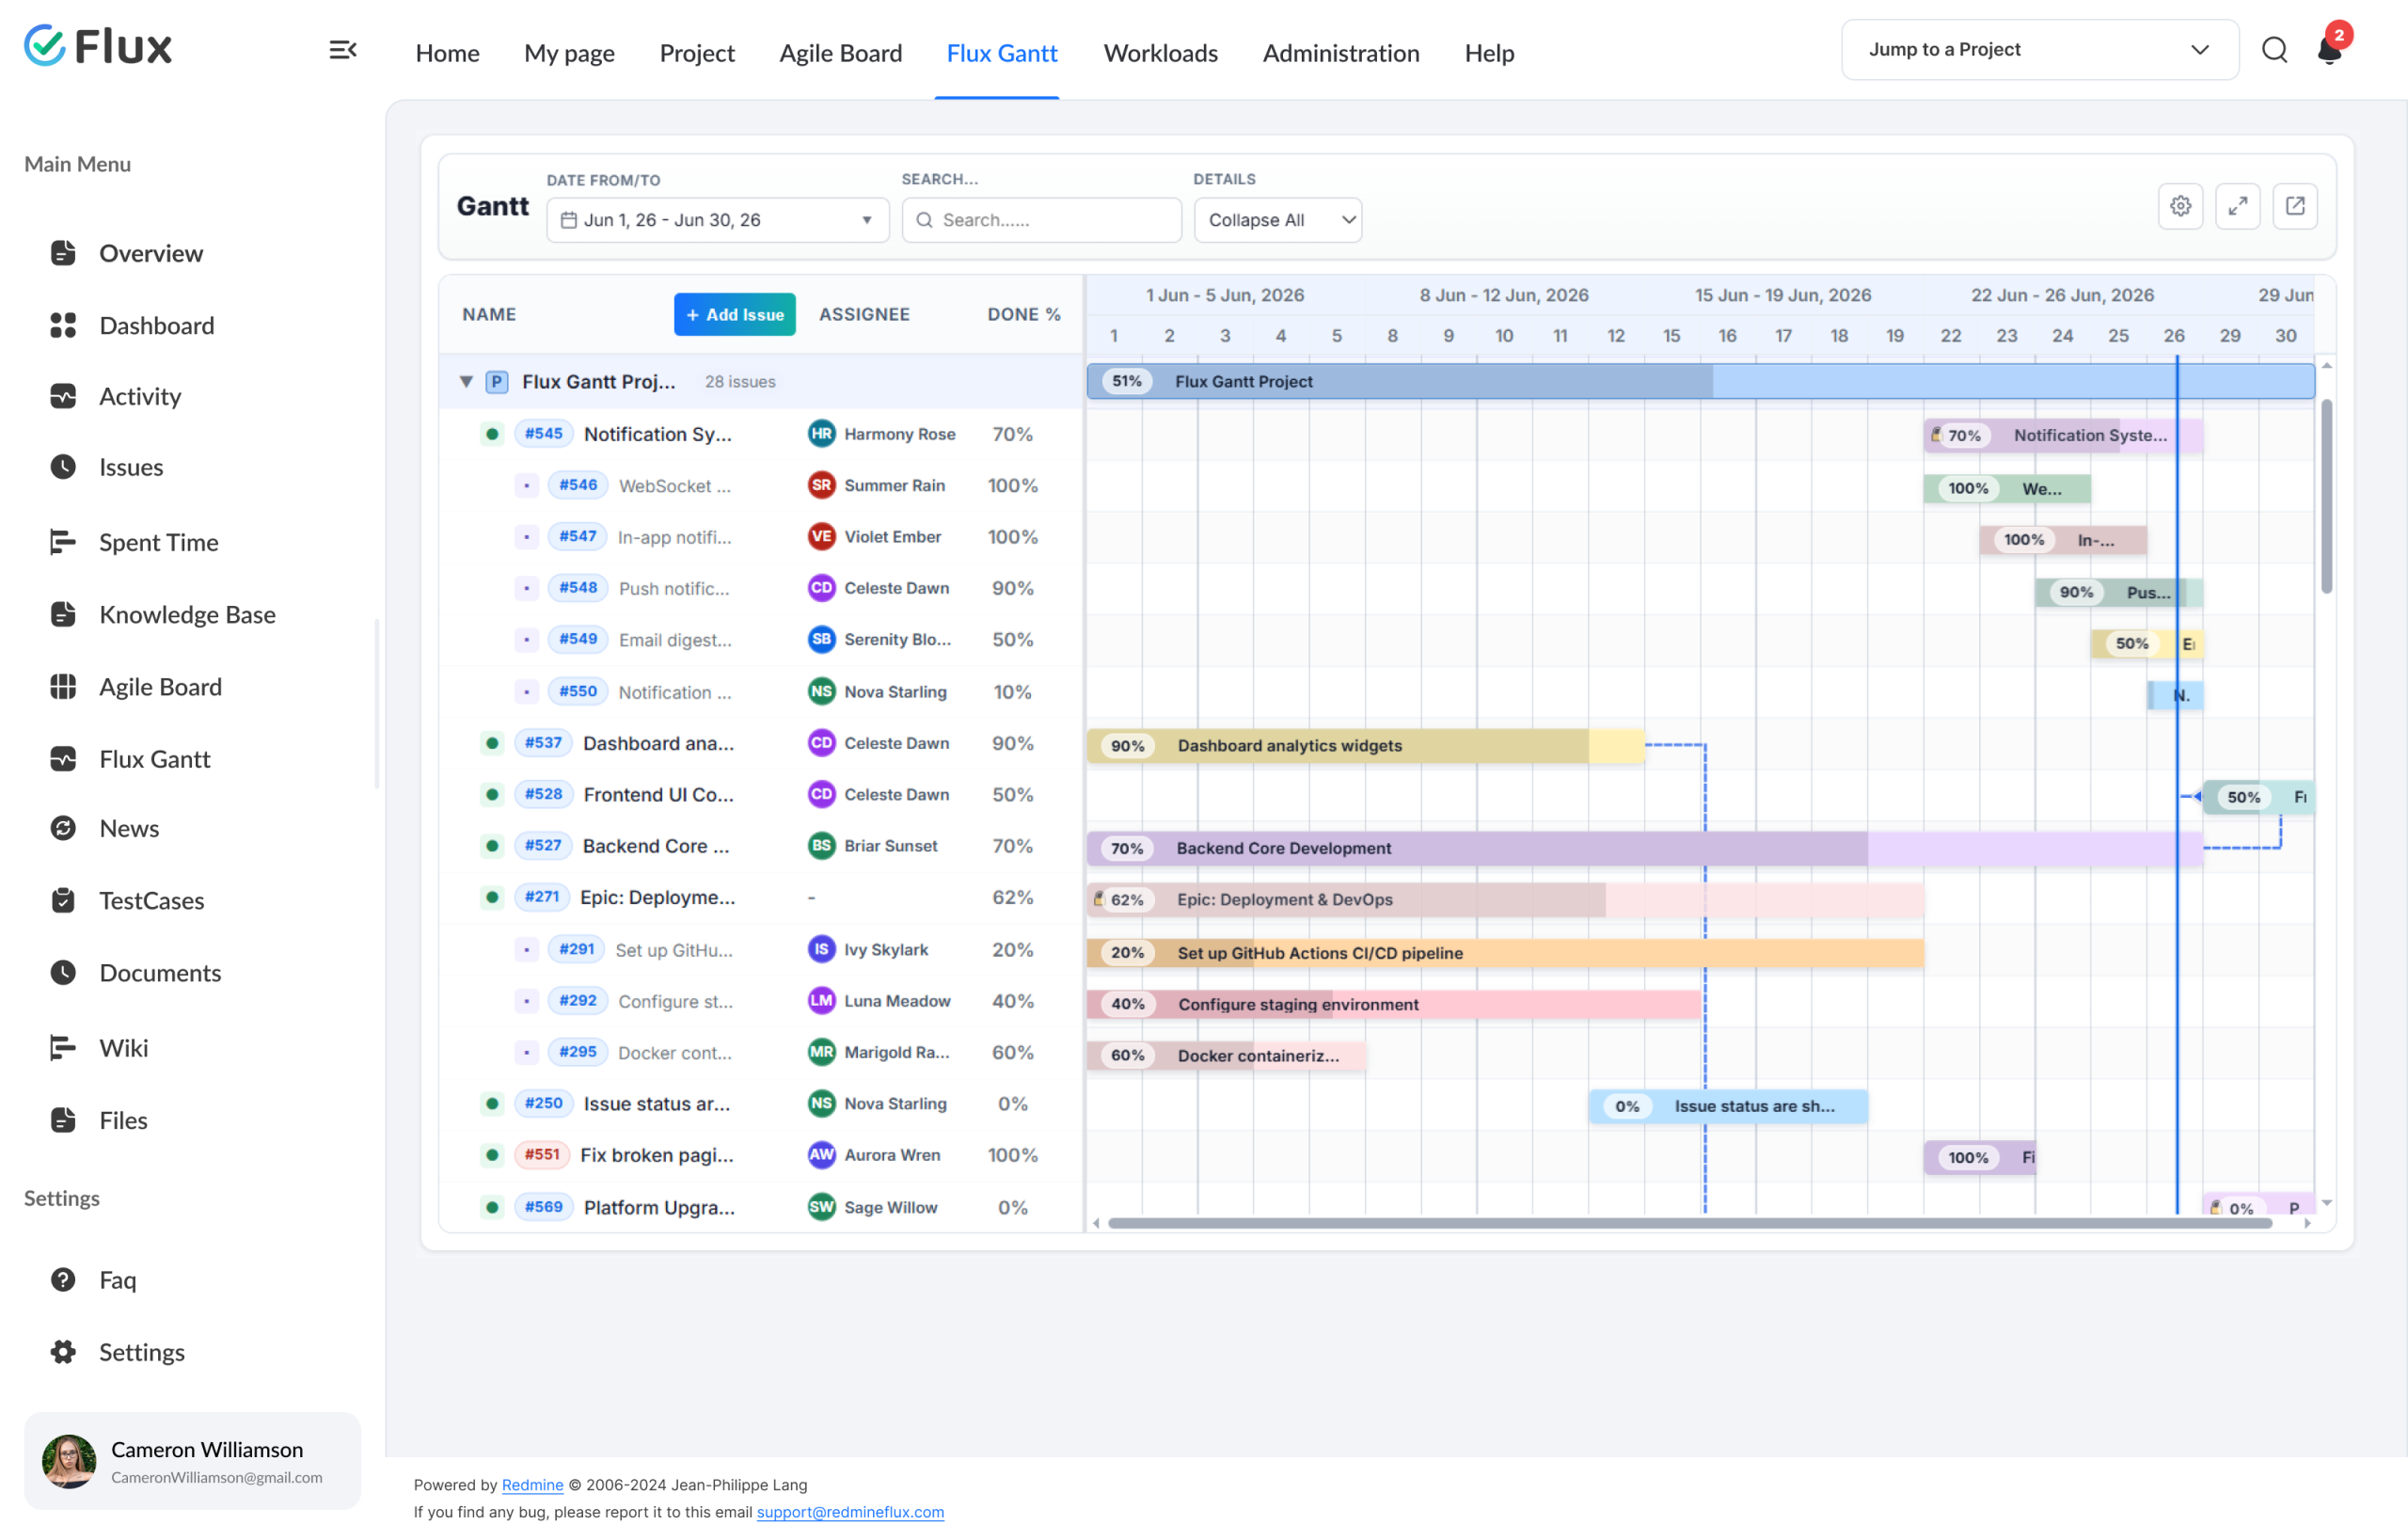
Schedule data that matches your issues, automatically.
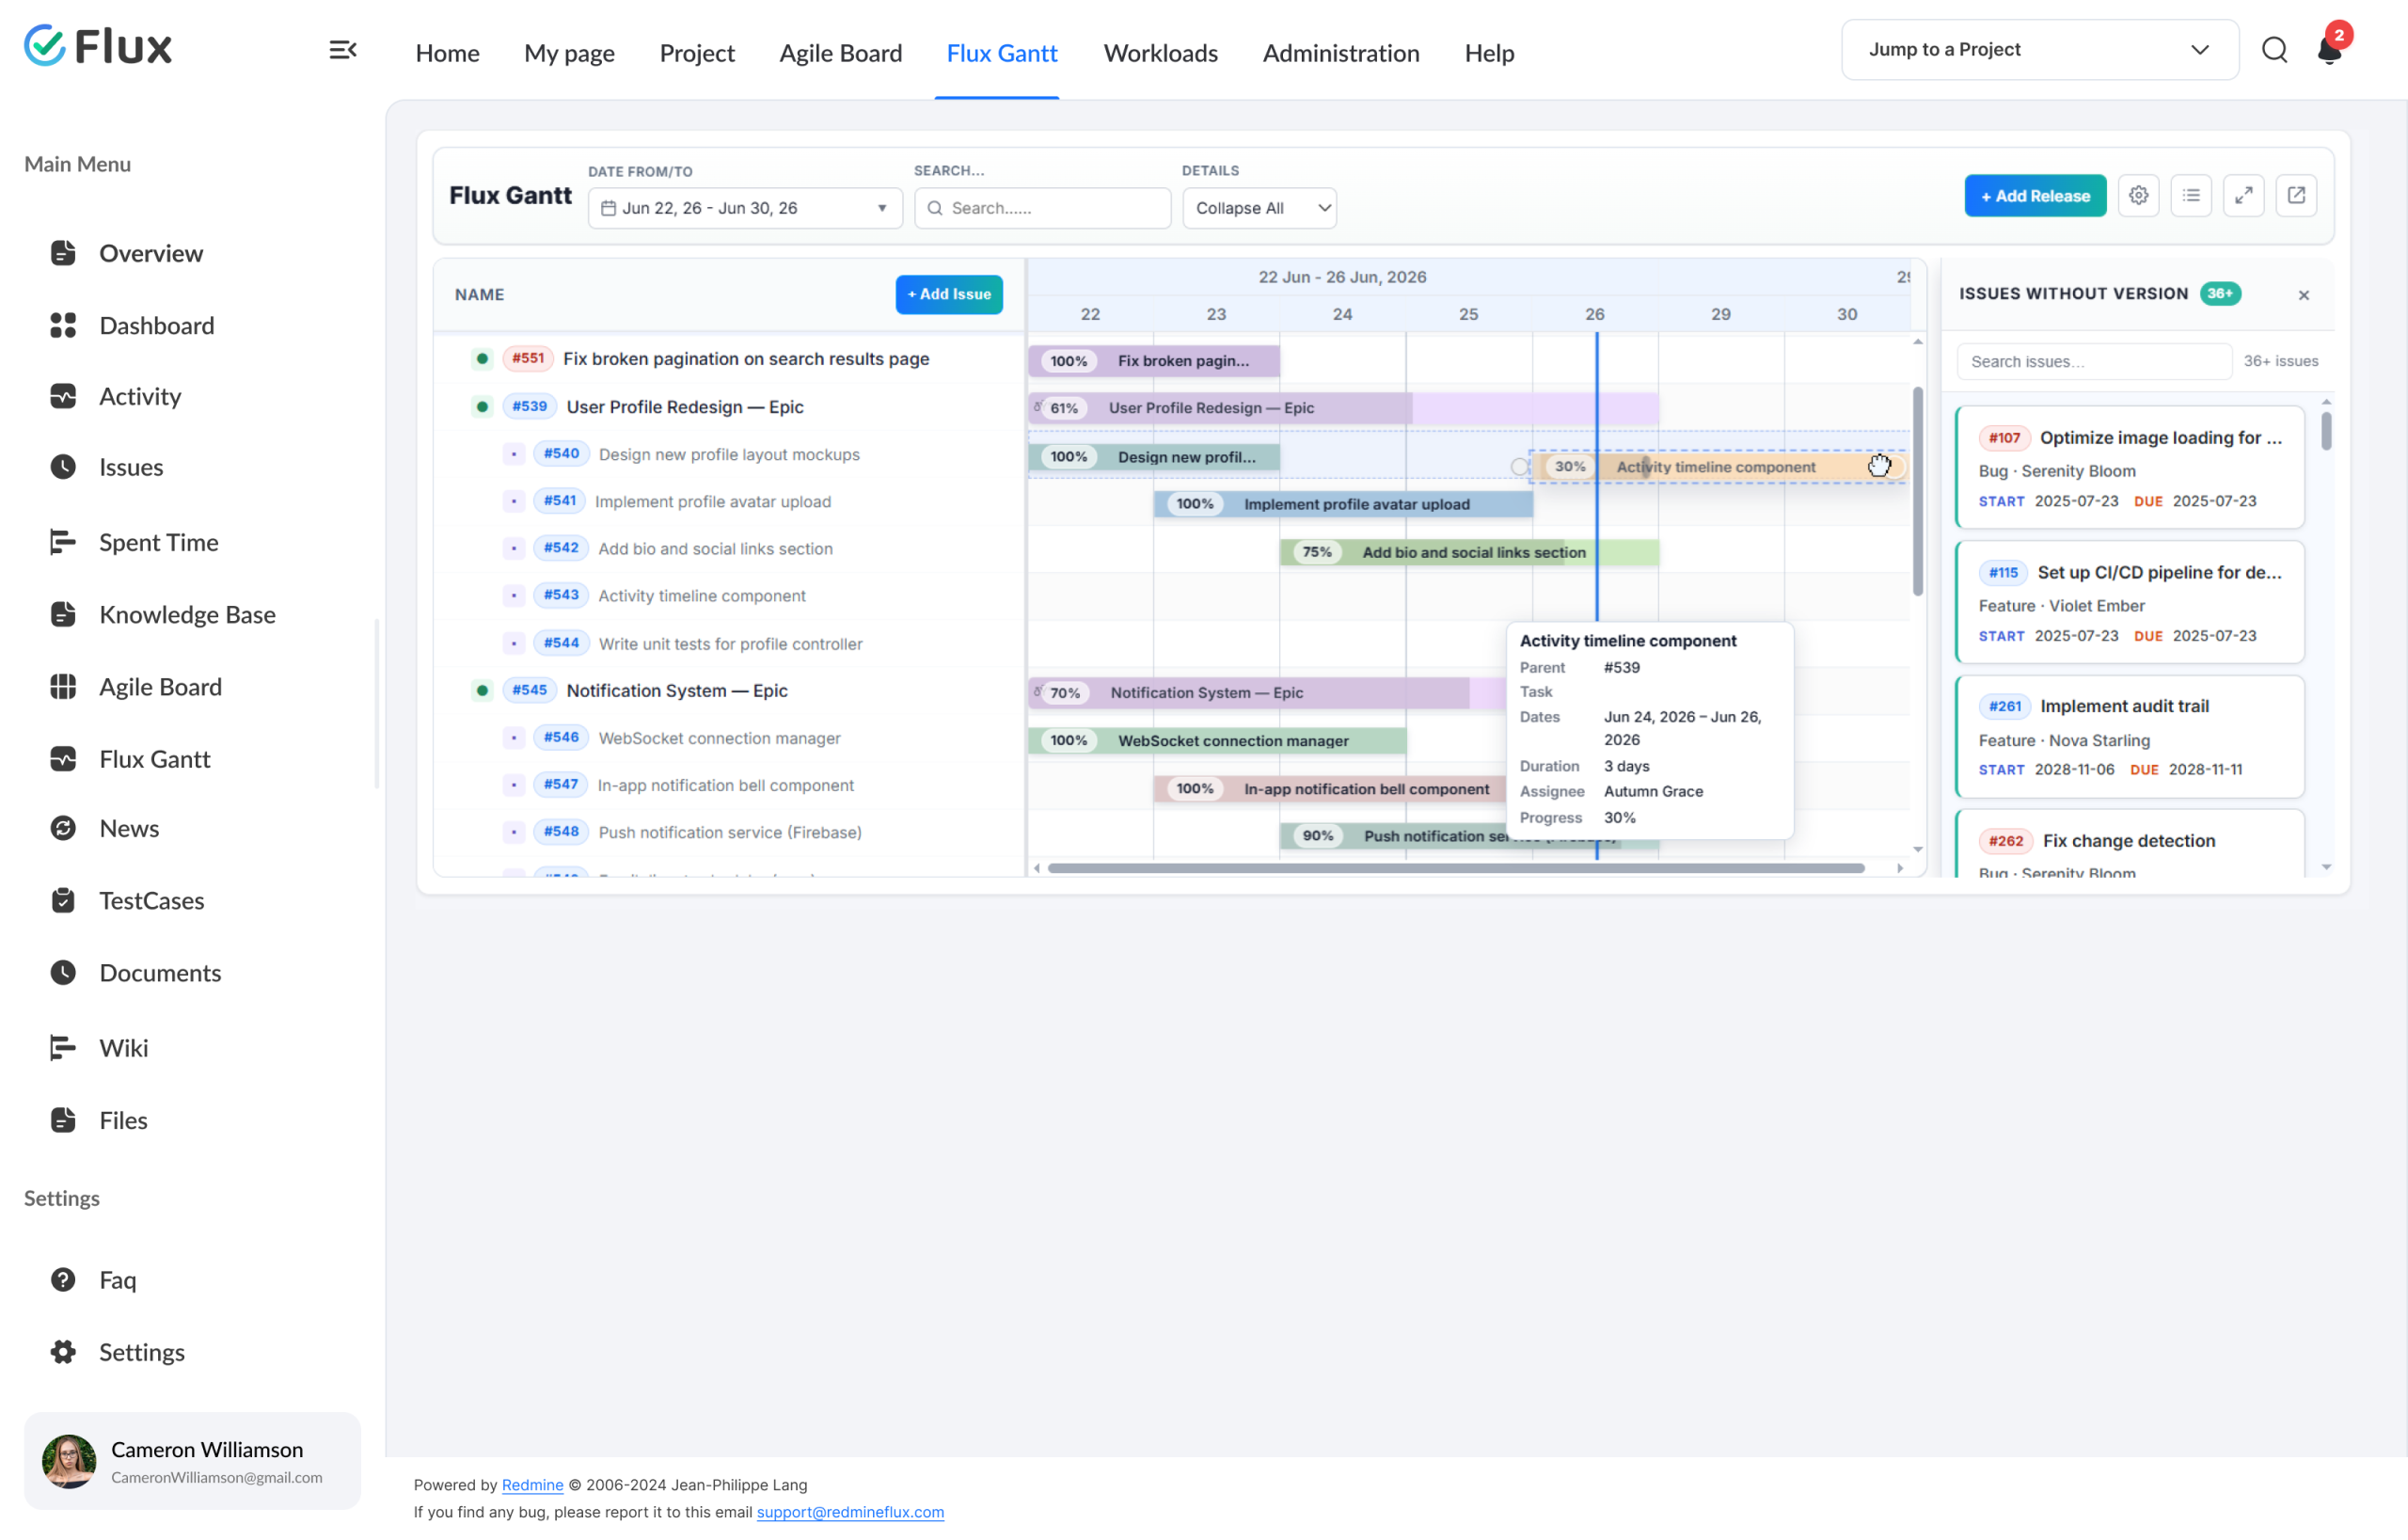
Click any shift to see what changes in the product.
01
Interactive rescheduling without editing individual issues.
Drag tasks on the chart to adjust dates, or resize the bar edge to change duration. Changes update immediately — dependency lines make the downstream impact visible so you can act before it becomes a missed deadline. Schedule management takes minutes rather than a full session of individual issue edits.
02
Dependency management that prevents cascade delays.
Link tasks to define finish-to-start and start-to-start relationships. When a linked upstream task moves, the dependency relationship makes the downstream impact immediately visible on the chart – before it becomes a missed deadline.
03
Release bars that anchor delivery checkpoints on the timeline.
Add a release with a name and date range to mark go-live dates, client review points, or version cut-offs. Release bars appear on the timeline alongside task bars — keeping delivery targets visible across the full project lifecycle without a separate planning layer.
04
Real-time schedule visibility for all stakeholders.
Schedule changes made by one project manager are visible to every team member and stakeholder with access to the project. There is no lag between a planning decision and its reflection in the timeline view.
05
All projects in one cross-project Gantt timeline.
The Global Flux Gantt is accessible from the top navigation and brings every project’s timeline into one view. Paginated project rows, lazy issue loading, cross-project dependency lines, and IssueQuery-based filters — all without switching between individual project Gantts.
Core capabilities
The specifics, for people who want them.
Plan and adjust schedules without leaving the chart.
- Drag-and-drop task rescheduling directly on the Gantt chart
- Resize task bars to adjust duration without opening issues
- Expand All / Collapse All for navigating the full task hierarchy
- All changes sync to Redmine issues in real time
Manage the relationships that determine delivery order.
- Finish-to-start and start-to-start dependency linking
- Visual dependency lines make sequencing clear on the chart
- Remove or edit dependency links directly on the chart without opening issues
- Add release bars to mark go-live dates and version cut-offs on the timeline
Adapt the timeline for different planning contexts.
- Filter by project, assignee, tracker, priority, or date range
- Zoom levels: Hours, Day, Week, and Month
- Work Days or Full Week display mode for planning and scheduling context
- Baseline comparison shows schedule drift against the original plan
Colour-code the timeline for faster scanning.
- Customise bar colors for releases, issues, and subtask bars independently
- Assign a per-issue color to make high-priority or at-risk work visually distinct
- Show or hide Assignee, Progress %, Estimated Hours, and Task ID columns
- Display settings and column preferences saved per user across sessions
200+
teams trust Redmineflux worldwide
6 yrs
focused on Redmine, nothing else
5000+
plugin downloads powering real projects
We had been maintaining a separate Gantt tool alongside Redmine for years. The Redmineflux Gantt Chart Plugin gave us the same functionality inside Redmine – and the schedule data now matches the issue data without any import step.
Deployment
Run it your way.
Managed Cloud
- Hosted by Redmineflux · included from Standard plan
- Daily backups · SLA-backed uptime
- No per-plugin licences – all-inclusive pricing
$2.99 / user / month
Get a Free DemoSelf-hosted
- Drop-in install on your own Redmine
- One-time purchase · 1 year of support included
- Your infrastructure, your security perimeter
From $499 one-time
Buy Plugin →Role by role
What Gantt Chart changes for each role.
Project ManagerTimeline planning, scheduling
Interactive timeline editing, dependency visibility, and release tracking in one view. Schedule decisions take minutes, not sessions of individual issue edits.
Delivery HeadProgramme oversight
Full project timeline clarity and schedule drift detection before deadlines slip. Baseline comparison makes slippage visible the moment it starts, not after.
IT Director / CTOGovernance + risk visibility
Governance over schedule, delivery risk, and resource commitment visibility. Cross-project schedule visibility via the Global Flux Gantt — all project timelines in one view, no reconciliation step.
Engineering LeadDependency management
Realistic scheduling with full dependency visibility. Engineers see how their task affects the delivery sequence and can update dates, progress, and assignee directly from the Gantt chart.
Pricing
Three ways to get Gantt Chart.
Buy this plugin
Gantt Chart – self-hosted
Support renewal after 1 year 30% of plugin price
One-time purchase · 1 year of support included · install on your Redmine in 15 minutes.
Buy Gantt Chart →Save with a Bundle
Project Management Bundle
Includes Gantt Chart + Agile Board + Custom Dashboard + Timesheet + Knowledge Base + Issue Template + Notification.
See the Bundle →Or use Managed Cloud
Redmineflux Cloud
Included in Standard and Pro Cloud plans. Managed Redmine, no infrastructure work. Book a free demo →
See Cloud plans →Try it on your real projects
See Gantt Chart with your live Redmine data.
Book a free demo and see Gantt Chart live, or install the plugin on your existing Redmine and have timeline planning live in 15 minutes.
Frequently asked
Frequently Asked Questions
The questions teams actually ask before adopting the Gantt Chart Plugin. If yours isn't here, check pricing or contact support.
Can I view tasks from multiple projects in one Gantt?
Yes. The Global Flux Gantt is accessible from the top navigation and displays all projects in a single cross-project timeline view. Projects appear as paginated rows with lazy issue loading. Cross-project dependencies are visible on the same chart, and IssueQuery-based filters let you narrow the view without switching between individual project Gantts.
Does the plugin support baseline comparisons?
Yes. Set a baseline from your original schedule and compare it against the current plan at any point during the project. Baseline comparison shows schedule drift visually on the chart, making it straightforward to identify which tasks have shifted and by how much since the project started.
Can multiple users edit the Gantt chart simultaneously?
Yes. Multiple project managers or team leads can work on the Gantt chart at the same time. Changes made by one user are reflected in real time for others viewing the same project. Conflict handling follows Redmine’s standard issue locking behaviour for concurrent edits.
Which Redmine versions are supported?
The Redmineflux Gantt Chart Plugin is tested and maintained against all Redmine versions. Compatibility is verified with each plugin update.
How much does it cost?
$499 one-time for self-hosted – 1 year of support included. Support renewal after 1 year 30% of plugin price. Bundle with the Project Management Bundle ($2,456 one-time) for Gantt Chart + Agile Board + Custom Dashboard + Timesheet + Knowledge Base + Issue Template + more. Or hosted at $2.99/user/month via Redmineflux Cloud Standard and above. See the pricing section above.
Is there a free demo available?
Yes – request a free demo and we’ll send a personalised demo link straight to your inbox. No credit card required, no commitment. Explore the real product at full capacity, at your own pace. Cloud starts at $1.99/user/month.